The following analysis comparing 2000 and 2004 results by county explains why the Kerry camp was optimistic about Ohio early in the day but how Bush ultimately won.
In comparing the 2004 results to 2000, it's important to remember that Bush beat Gore by 165,019 votes in 2000. That meant that for Kerry to win in 2004, he would need to net an additional 165,020 votes from somewhere. In looking at the results, it's clear that the Kerry campaign focused on increasing turnout in urban and college-based counties to get these votes.
The Kerry team was very successful at this. They actually netted more votes than Gore in 22 of Ohio's 88 counties. This included urban counties such as Cuyahoga (Cleveland), Franklin (Columbus), Hamilton (Cincinnatti), Summit (Akron), Lucas (Toledo), and Stark (Canton). Another commonality among the list of counties where Kerry improved over Gore's 2000 performance was the existence of a large or medium-sized university. In addition to all of the counties above which have colleges, he also improved over Gore's 2000 performance in Wood (Bowling Green State University) and Athens (Ohio University) counties.
In reality this explanation makes Kerry improved performance seem far wider than it really was. As the graph below illustrates, almost two thirds of Kerry's net gains came from two counties (Cuyahoga and Franklin). Interestingly, Kerry's third largest net gain came in Hamilton county which still went to Bush, but by 19,000 less votes than it did in 2000.

When looking at only these 22 counties, Kerry had a net gain of 182,500 votes. If the rest of Ohio performed exactly as it did in 2000, Kerry would have won by a little over 17,000 votes. Clearly the Kerry campaign was focused on these counties and saw these results as a good sign.
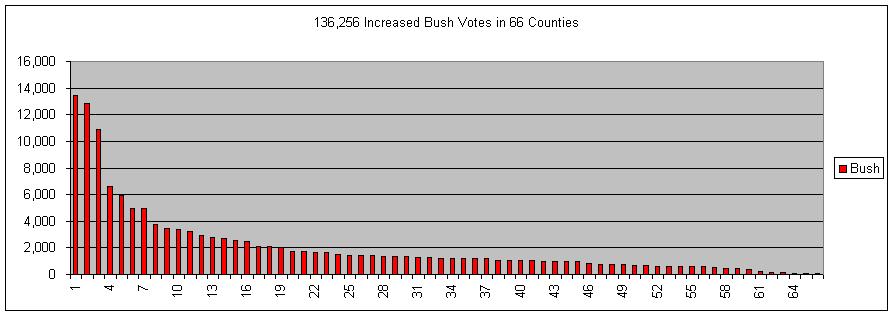
The problem for Kerry was that while he was doing extremely well in a few counties, Bush was showing small consistent improvements across the rest of the state. In the end, Bush had an average net gain of a little over 2,000 votes in 66 different counties for a total net increase of 136,256 votes across these 66 counties. That easily made up for Kerry's improvements described above.
The graph below illustrates how Bush had relatively small net gains across the 66 remaining Ohio counties. His largest net gains came in Butler, Warren, and Clarmont counties - all suburbs of Cincinnatti.
I think these graphs also demonstrate why the allegations of voter fraud and suppression are baseless. As these graphs indicate, if anyone was trying to surpress the vote in Cuyahoga or Franklin county, they failed miserably. Bush won despite the increased turnout in these areas.
It also demonstrates that if there was fraud involved in generating additional Bush votes, it would have had to have been spread across 66 different Ohio counties. Throw in the fact that most of these Bush counties use punch cards and you can't even blame the electronic voting machines.
In the end, Bush won Ohio the same way he won the rest of the country - offsetting large Kerry gains in urban areas with small consistent victories everywhere else.
|